> ## Documentation Index
> Fetch the complete documentation index at: https://bun.zhcndoc.com/llms.txt
> Use this file to discover all available pages before exploring further.
# 使用网页调试器调试 Bun
Bun 使用 [WebKit Inspector Protocol](https://github.com/oven-sh/bun/blob/main/packages/bun-inspector-protocol/src/protocol/jsc/index.d.ts)。要在使用 Bun 运行代码时启用调试,请使用 `--inspect` 标志。为了演示,请考虑以下 Web 服务器。
```ts server.ts icon="https://mintcdn.com/bun-zhcndoc/cnUTwgMuf4cCrwC-/icons/typescript.svg?fit=max&auto=format&n=cnUTwgMuf4cCrwC-&q=85&s=e7767043c9e885c34f2d6c8fe2a95217" theme={"theme":{"light":"github-light","dark":"dracula"}}
Bun.serve({
fetch(req) {
console.log(req.url);
return new Response("Hello, world!");
},
});
```
***
让我们使用 `--inspect` 标志运行这个文件。
这会自动在一个可用端口启动一个 WebSocket 服务器,可用于检测正在运行的 Bun 进程。各种调试工具都可以连接到这个服务器,从而提供交互式调试体验。
Bun 在 [debug.bun.sh](https://debug.bun.sh) 托管了一个基于网页的调试器。它是 WebKit 的 [Web Inspector Interface](https://webkit.org/web-inspector/web-inspector-interface/) 的修改版本,对于 Safari 用户来说会很熟悉。
```sh terminal icon="terminal" theme={"theme":{"light":"github-light","dark":"dracula"}}
bun --inspect server.ts
```
```txt theme={"theme":{"light":"github-light","dark":"dracula"}}
------------------ Bun Inspector ------------------
Listening at:
ws://localhost:6499/0tqxs9exrgrm
Inspect in browser:
https://debug.bun.sh/#localhost:6499/0tqxs9exrgrm
------------------ Bun Inspector ------------------
```
***
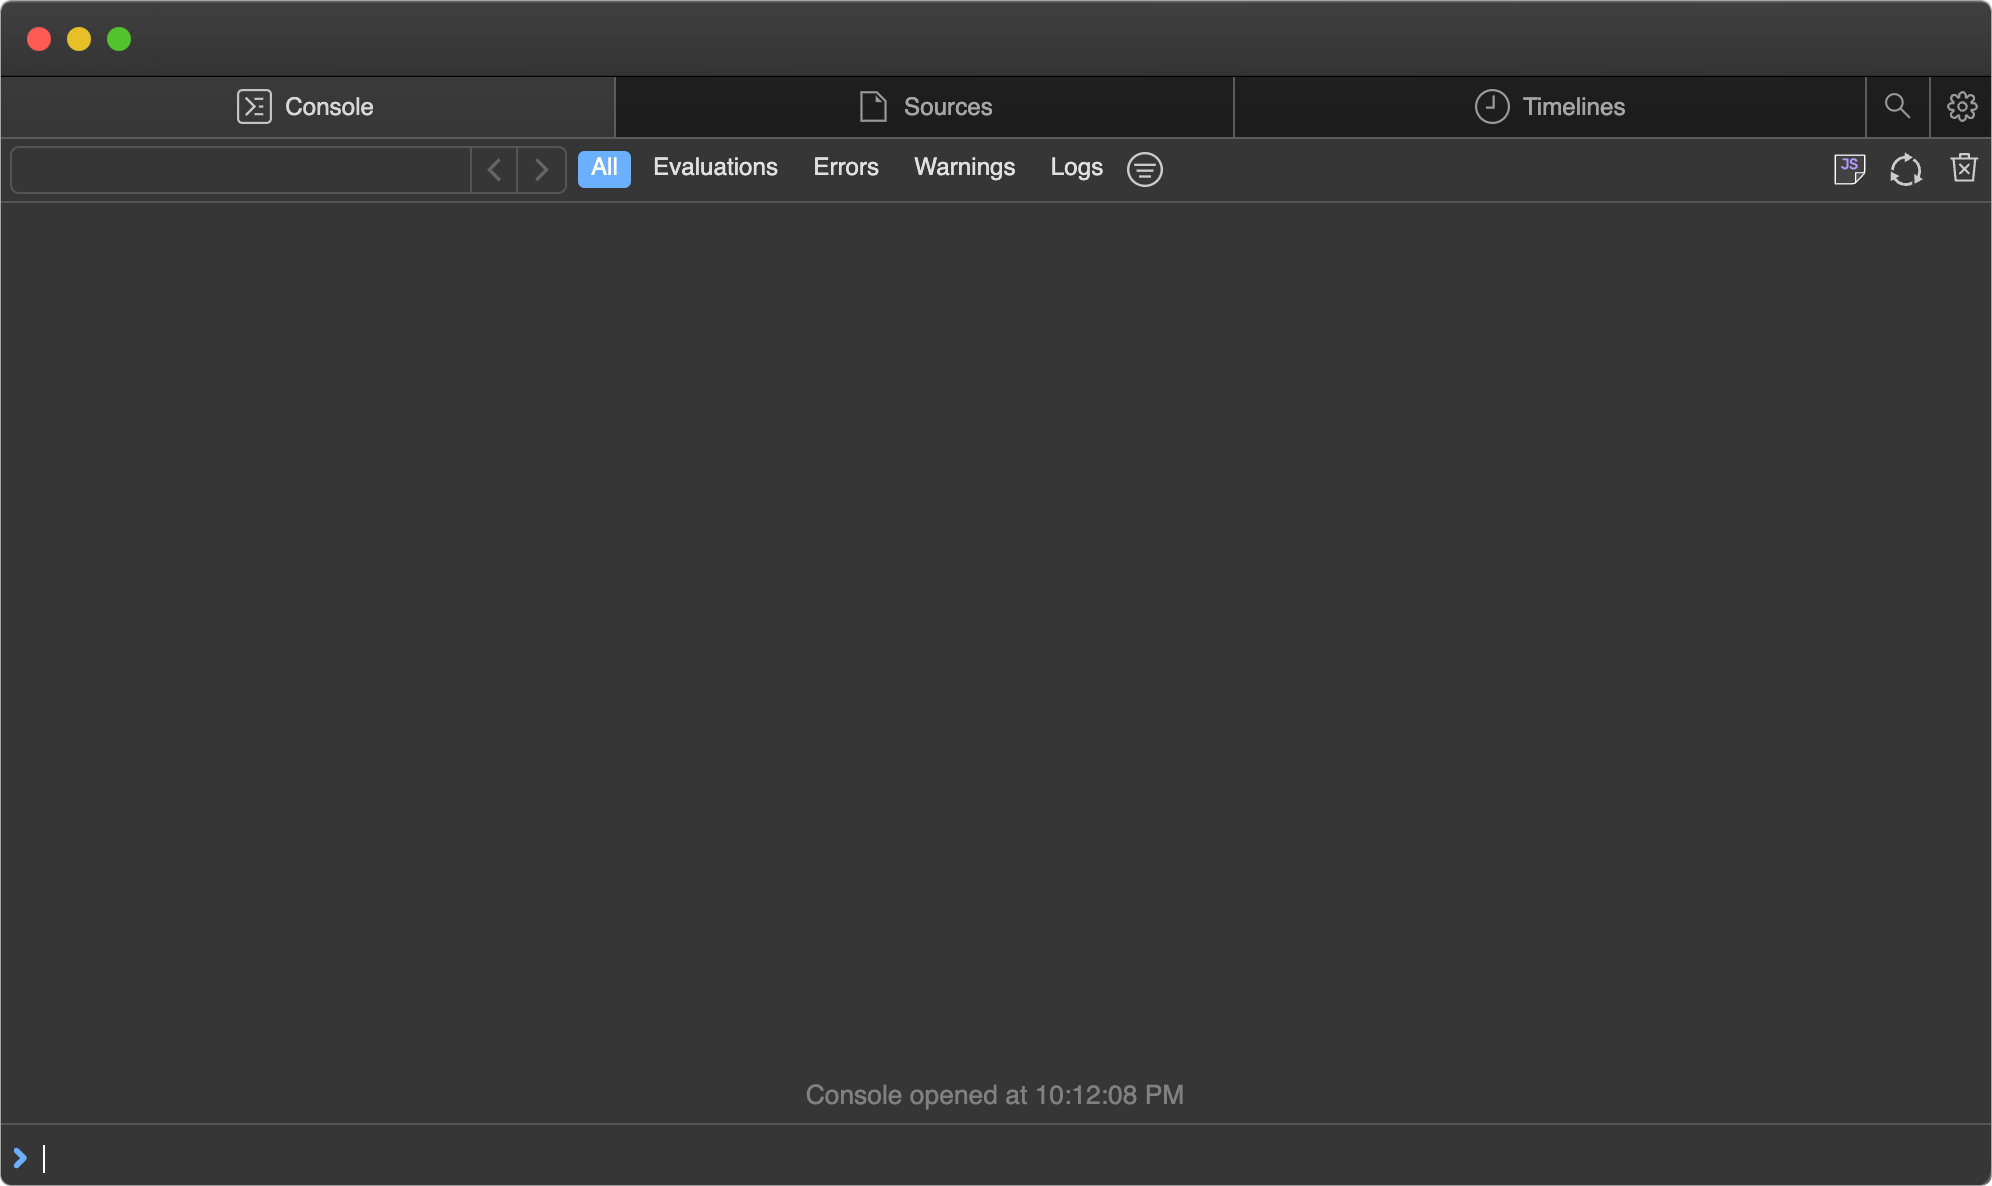
在浏览器中打开提供的 `debug.bun.sh` URL,开始调试会话。在此界面中,你可以查看正在运行文件的源代码,查看和设置断点,并通过内置控制台执行代码。
***
让我们设置一个断点。导航到 Sources 标签页,你应该能看到之前的代码。点击第 `3` 行的行号,在 `console.log(req.url)` 语句上设置断点。

***
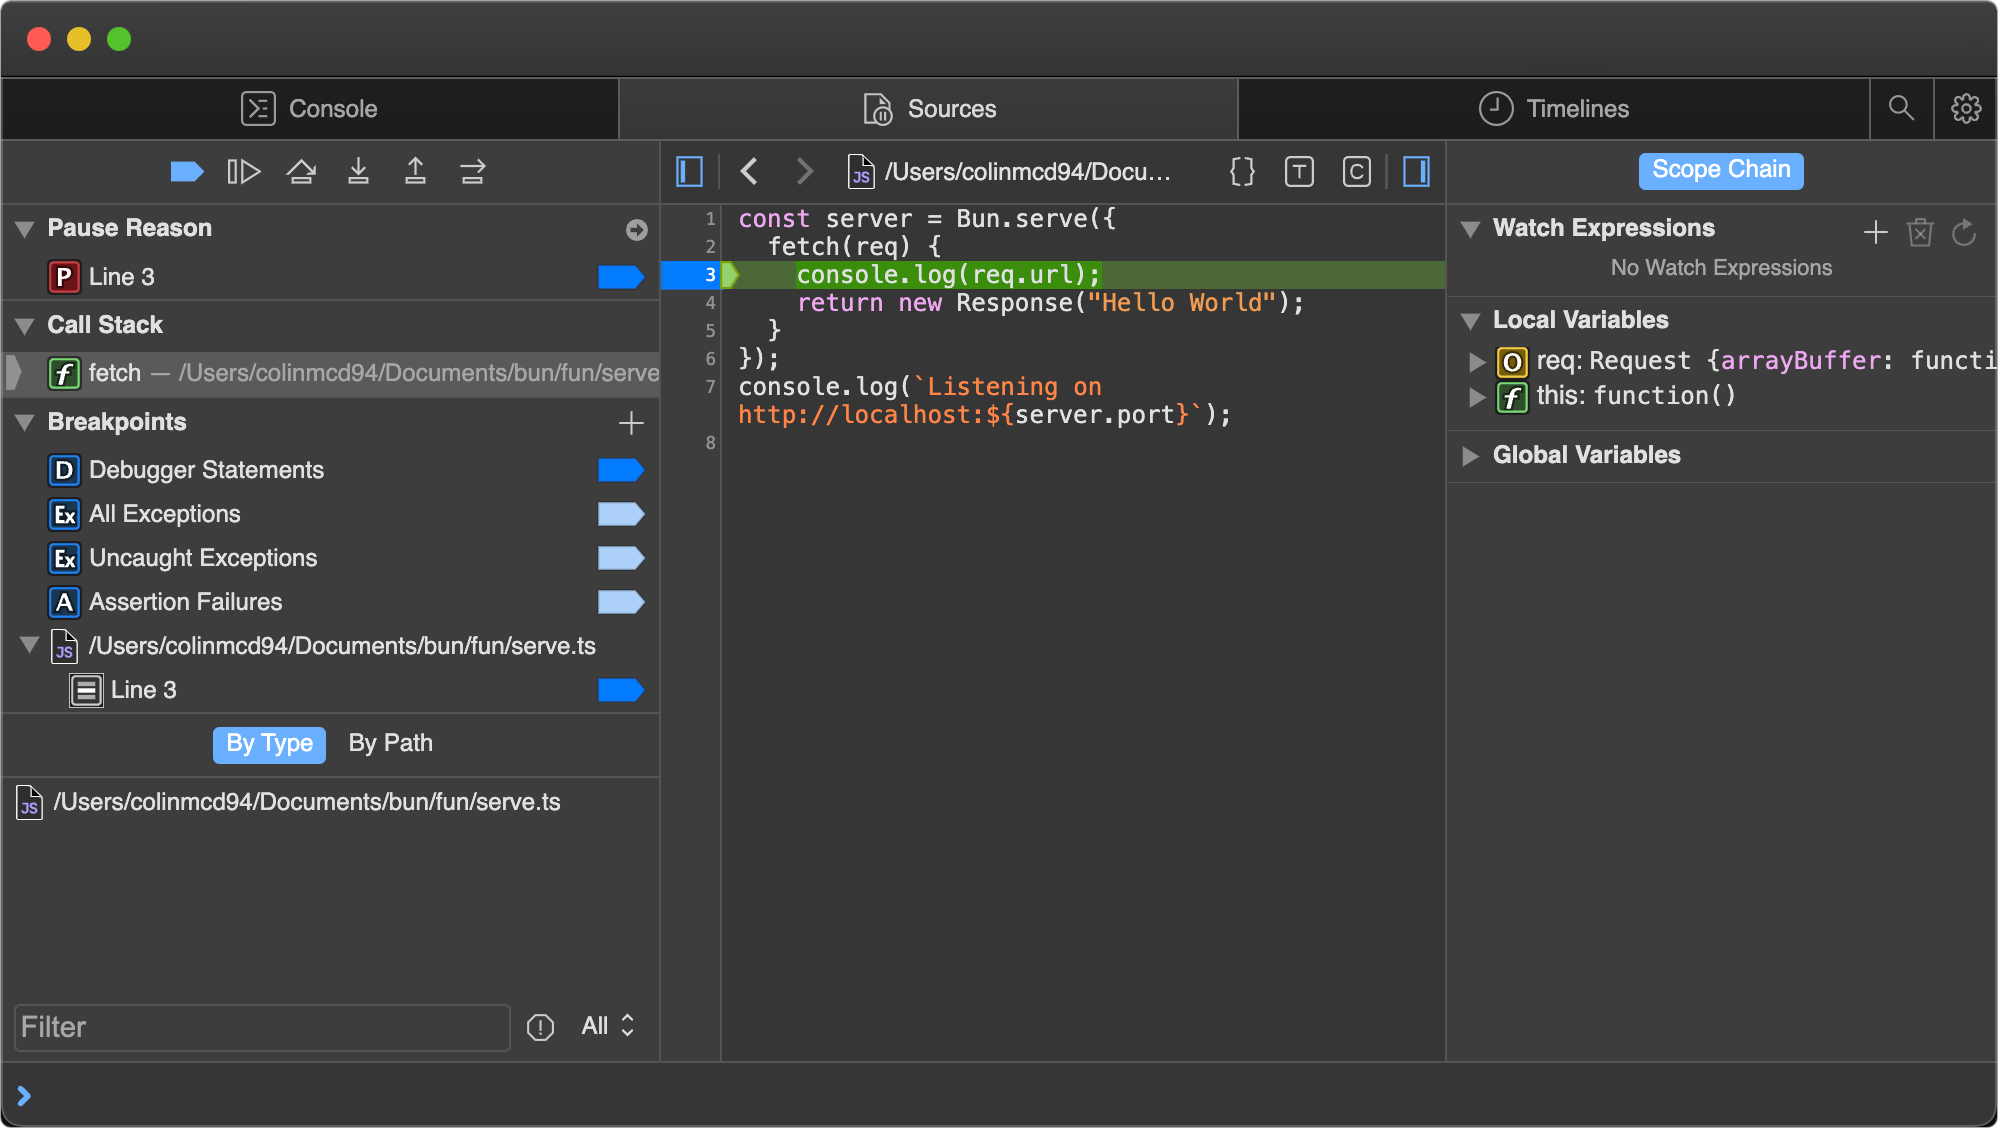
然后在网页浏览器中访问 [`http://localhost:3000`](http://localhost:3000)。这会向我们的 `localhost` Web 服务器发送 HTTP 请求。页面看似没有加载,为什么呢?因为程序在我们之前设置的断点处暂停执行。
注意界面已发生变化。
***
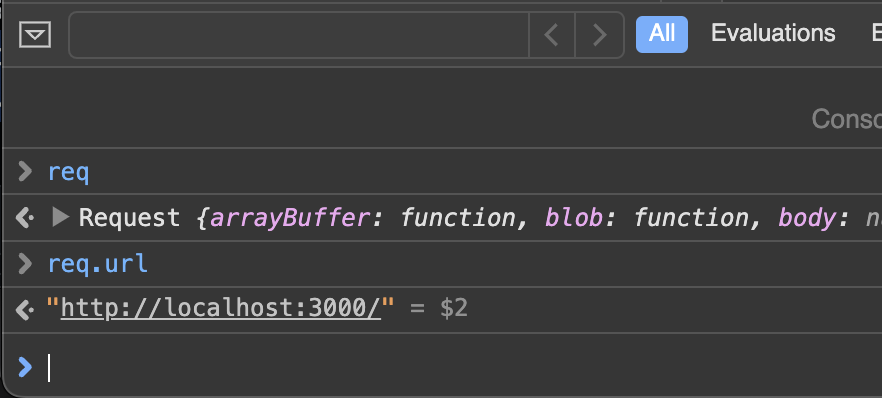
此时我们可以做很多事情来检查当前执行环境。我们可以使用底部的控制台,在程序上下文中运行任意代码,可以完整访问断点处作用域内的变量。
***
在 Sources 面板的右侧,我们可以看到当前作用域内所有本地变量,并深入查看它们的属性和方法。这里,我们正在检查 `req` 变量。

***
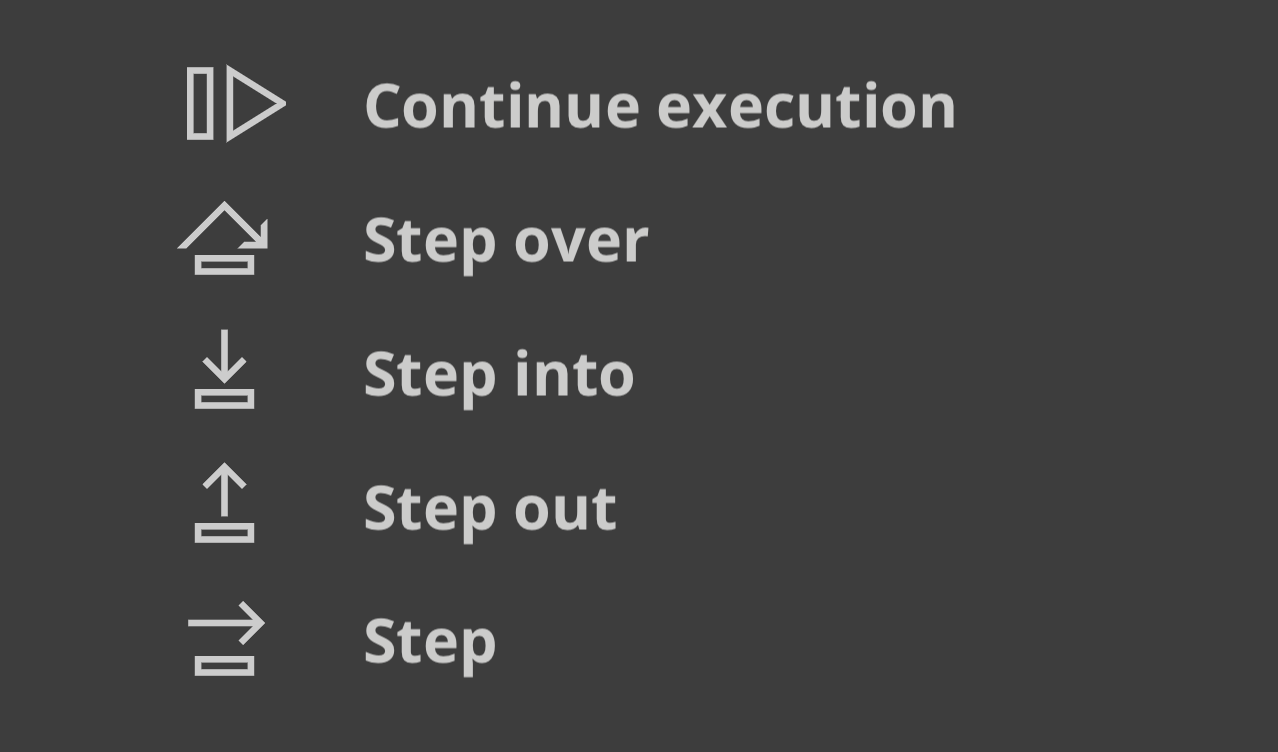
在 Sources 面板的左上方,我们可以控制程序的执行。

***
这是控制流按钮功能的速查表。
* *继续执行脚本* — 继续运行程序直到下一个断点或异常。
* *单步跳过* — 程序将继续执行下一行代码。
* *单步进入* — 如果当前语句包含函数调用,调试器将“单步进入”该函数。
* *单步跳出* — 如果当前语句是函数调用,调试器将执行完该调用,然后“单步跳出”到函数被调用的位置。